You may have heard in the news recently that the USDA updated its plant hardiness zone map for the first time since 2012.
The updated map now shows southern Nebraska—including Lincoln and Omaha—as having moved from its previous position in Zone 5B to Zone 6A, which means the average lowest temperature rose from between -15 and -10 degrees Fahrenheit to -10 to -5 degrees Fahrenheit – a five-degree increase.
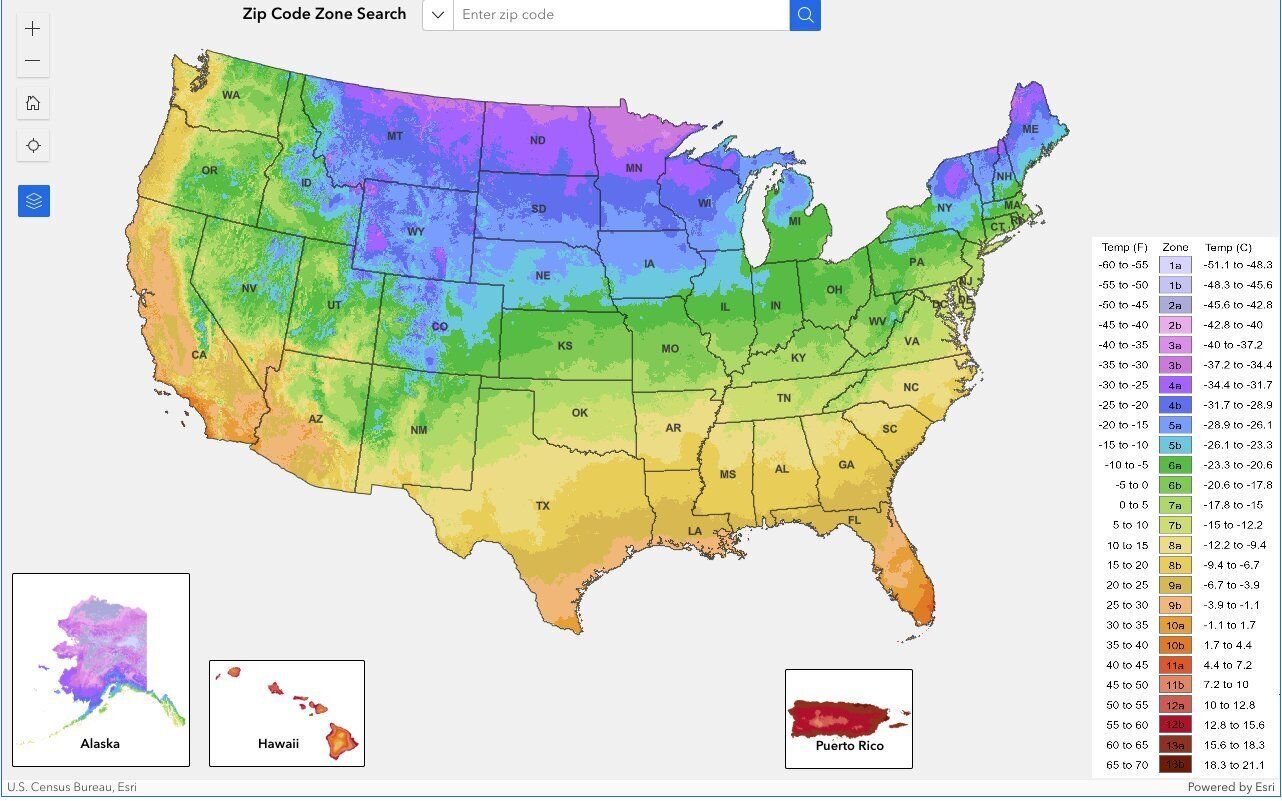
The 2023 map, which is based on 30-year averages of the lowest annual winter temperatures at specific locations, is divided into 10-degree Fahrenheit zones and further divided into 5-degree Fahrenheit half-zones. Gardeners often look to the plant hardiness zone map to determine which perennials are most likely to thrive in a particular location.
The new map for 2023 pushed about half the United States into a warmer half zone, while the rest of the country remained the same.
Although southern Nebraska is officially now in a new plant hardiness half-zone, NSA Green Infrastructure Coordinator Justin Evertson urges gardeners to take the shift with a grain of salt.
“It's important to keep in mind that these zones are based on averages,” Evertson cautioned. “The average lowest temperature in Zone 6A is -10 to -5 degrees, but in February 2021, we were 25 to 30 degrees below zero across much of the region.”
Evertson also reminded gardeners and landscapers that it’s the sudden drops in both spring and fall that are hardest on trees and other plants in Great Plains landscapes, which is a nuance not reflected in the plant hardiness zone map. The map also considers only winter temperatures and therefore does not reflect the increasing heat stress we are seeing in our Nebraska summers.
That said, the plant hardiness zone map is a useful resource that gardeners would be wise to consult, especially before experimenting with new perennials. Experts suggest using the map as a guideline, rather than relying on it as a guarantee.
To see an animation of the general warming trend between 2006 and 2023, visit the Arbor Day Foundation’s zone change map and click “play.” To find out which plant hardiness zone you are in, type your zip code into the USDA’s interactive map.